⭐
Research Background
1. Research Objectives
① Assess job satisfaction in 2024
② Summarize corporate performance in 2024
③ Forecast expected performance in 2025
2. Research and Analysis Methods
① Survey questionnaire
② The questionnaire is primarily based on the Job Satisfaction Survey (JSS) developed by Spector, P. E. (1994).
3. Key Considerations in Questionnaire Design
① A well-designed questionnaire emphasizes response stability, often presenting the same question in different forms to ensure consistency.
② It evaluates various factors across multiple dimensions.
③ The measurement dimensions align closely with the research objectives.
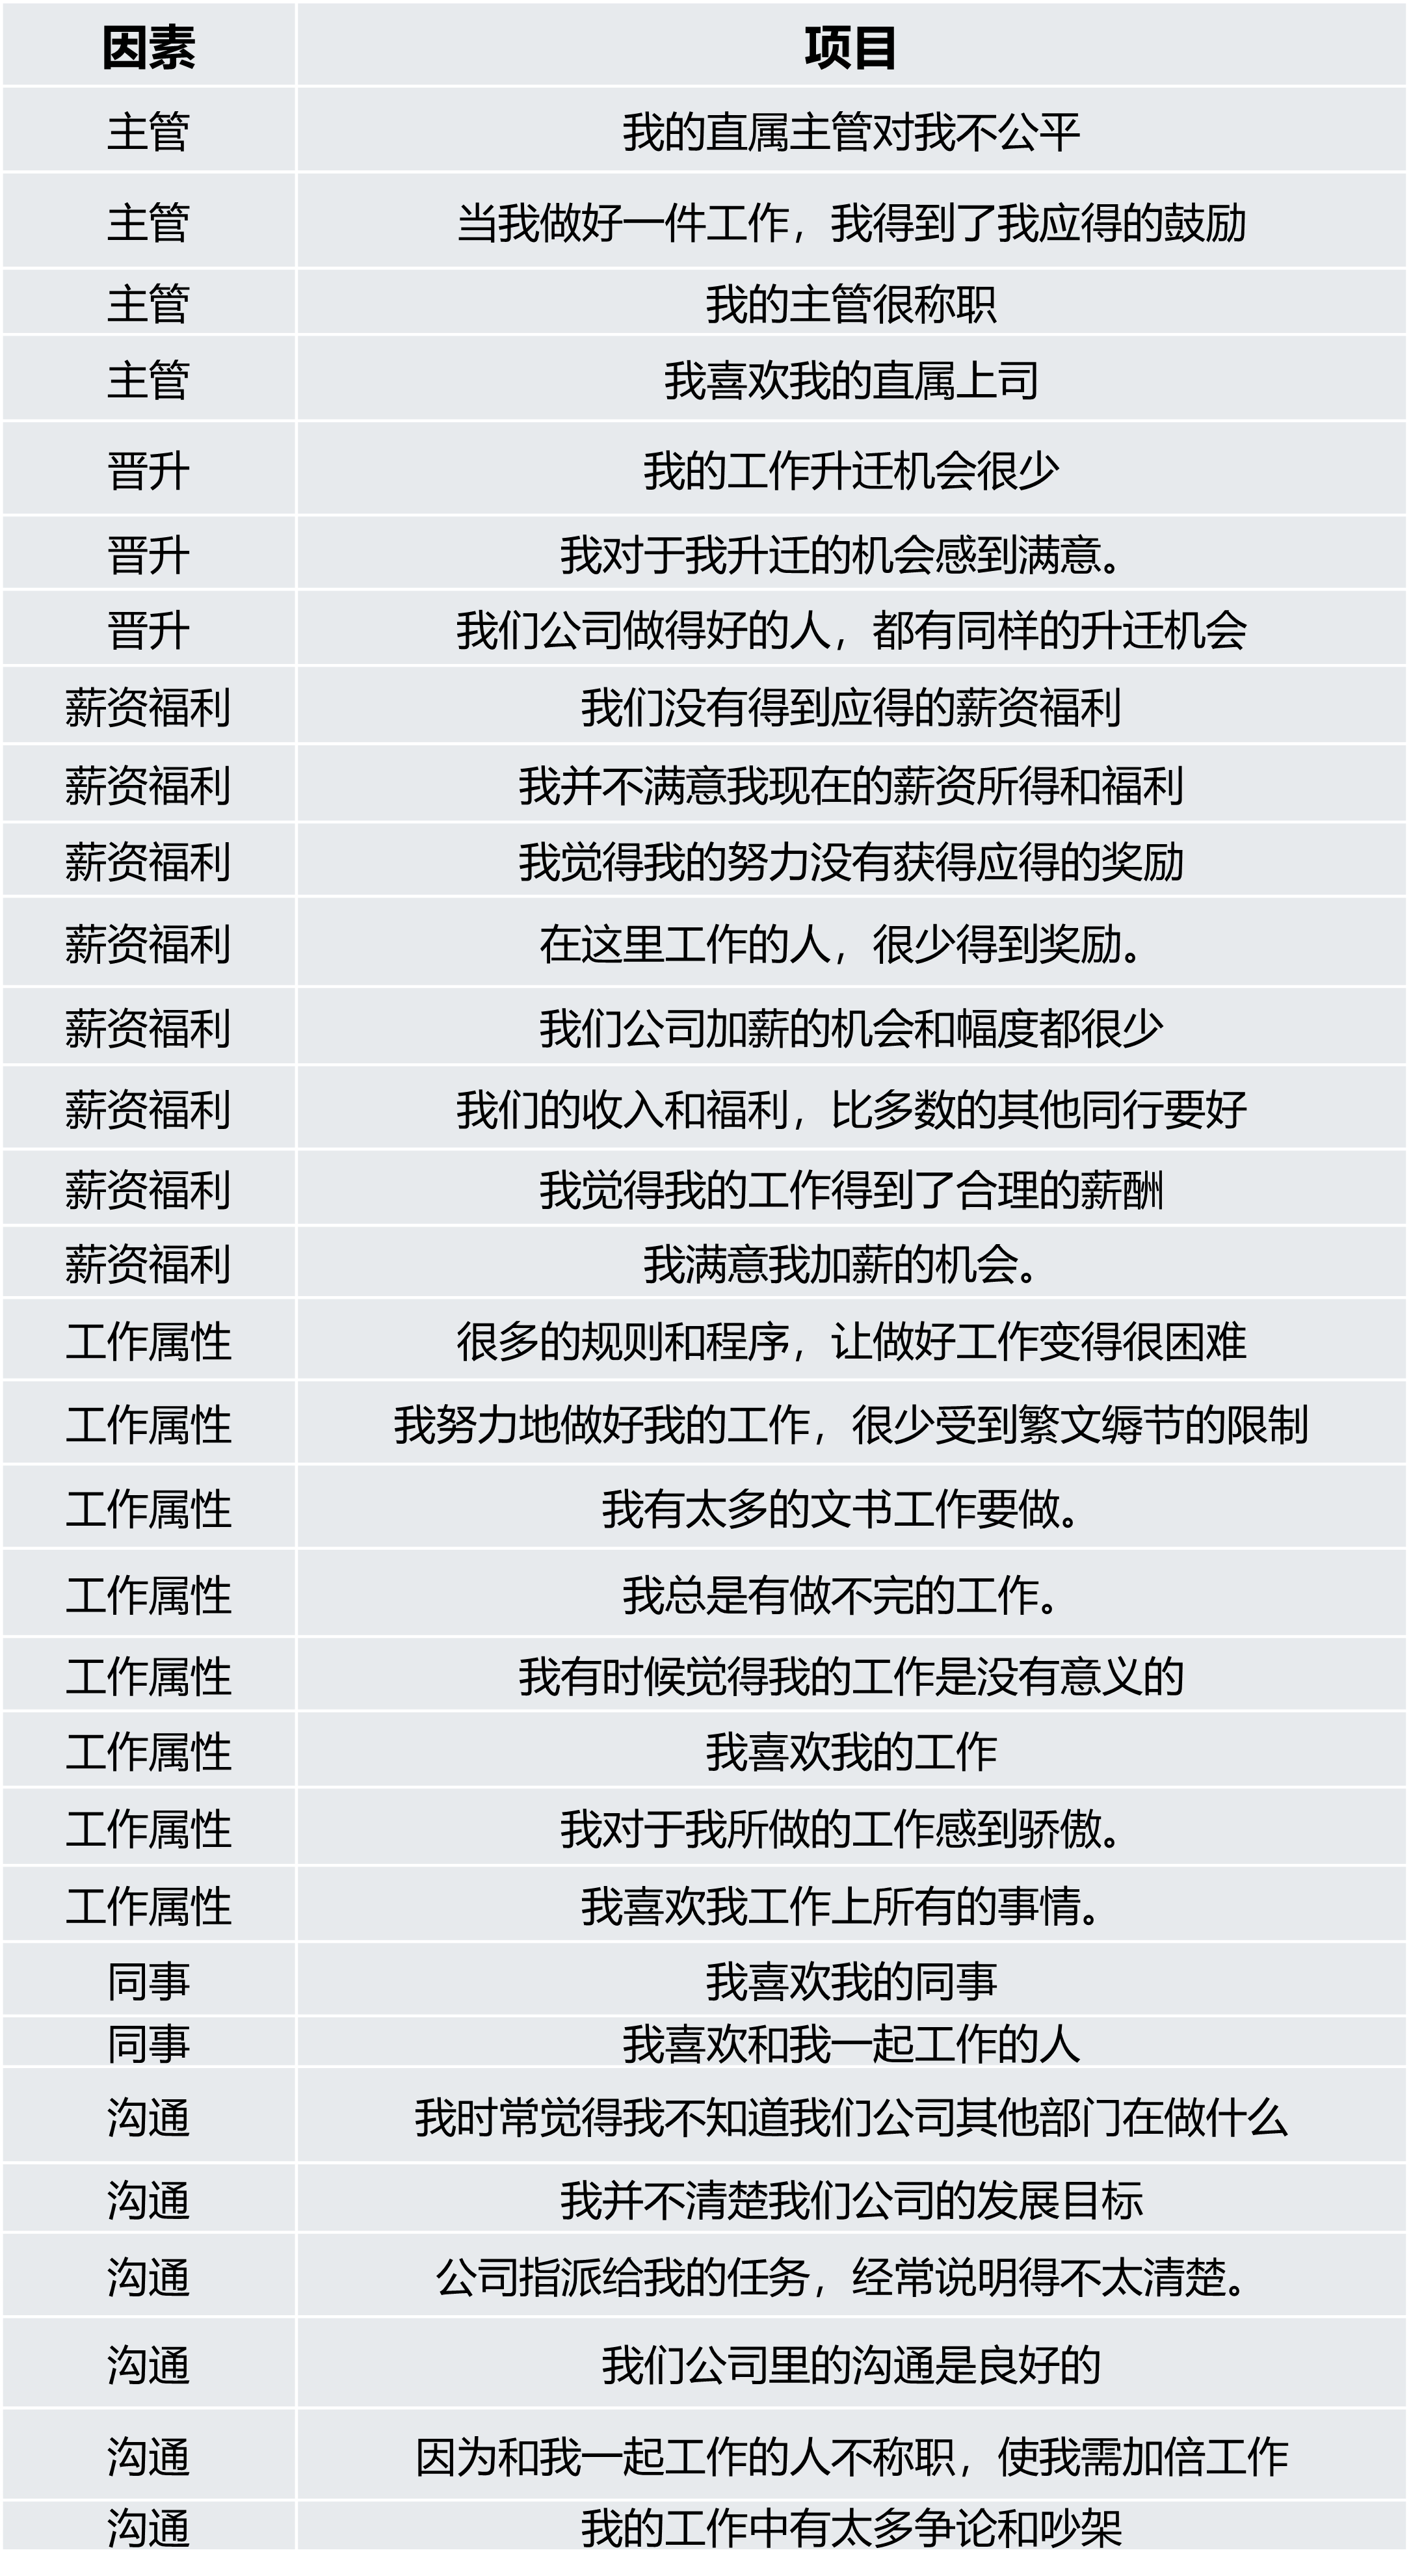
The Job Satisfaction Survey (JSS) published by Spector, P. E. (1994)
4. Data Analysis Methods
① Evaluated the internal consistency of the data using the Cronbach test, with a scale reliability coefficient ranging from 0.7 to 0.92.
② Analyzed the correlations between different questions within the same factor, ensuring a reasonable level of association.
③ Conducted factor analysis to assess discriminant validity between different factors.

Basic Information of Survey Participants
1、Gender Ratio

Gender Distribution: 56 females; 31 males.
This ratio aligns well with the characteristics of the fashion industry, which is predominantly female.
2. Age Ratio
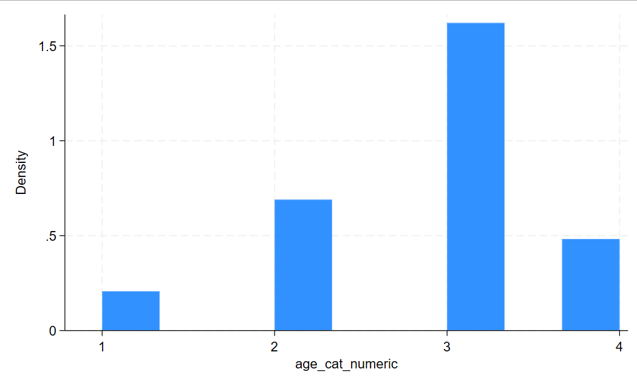
Age Distribution:
- 21-25 years old: 6.9%
- 26-30 years old: 22.9%
- 31-40 years old: 54.02%
- 41-50 years old: 16.09%
This age composition is, to some extent, related to the demographics of the Lengyun Fashion Circle, where the majority of participants are between 25 and 40 years old. This may introduce some bias in our data results.
3. Income Rdtio
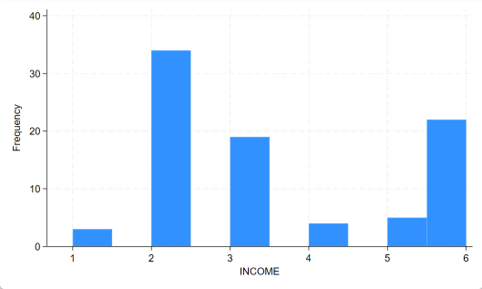
The majority of respondents have an annual income between 60,000 and 250,000 CNY, which aligns with the general income distribution of the broader population.
Potential Bias in the Survey Sample:
① The survey includes 87 responses, making it a small sample size. However, we verified data stability and validity during the analysis phase.
② The survey participants were primarily recruited from the Lengyun Fashion Circle, meaning the demographic composition of this community may have influenced the survey results.

Main Issues Affecting Various Factors
1、supervisor
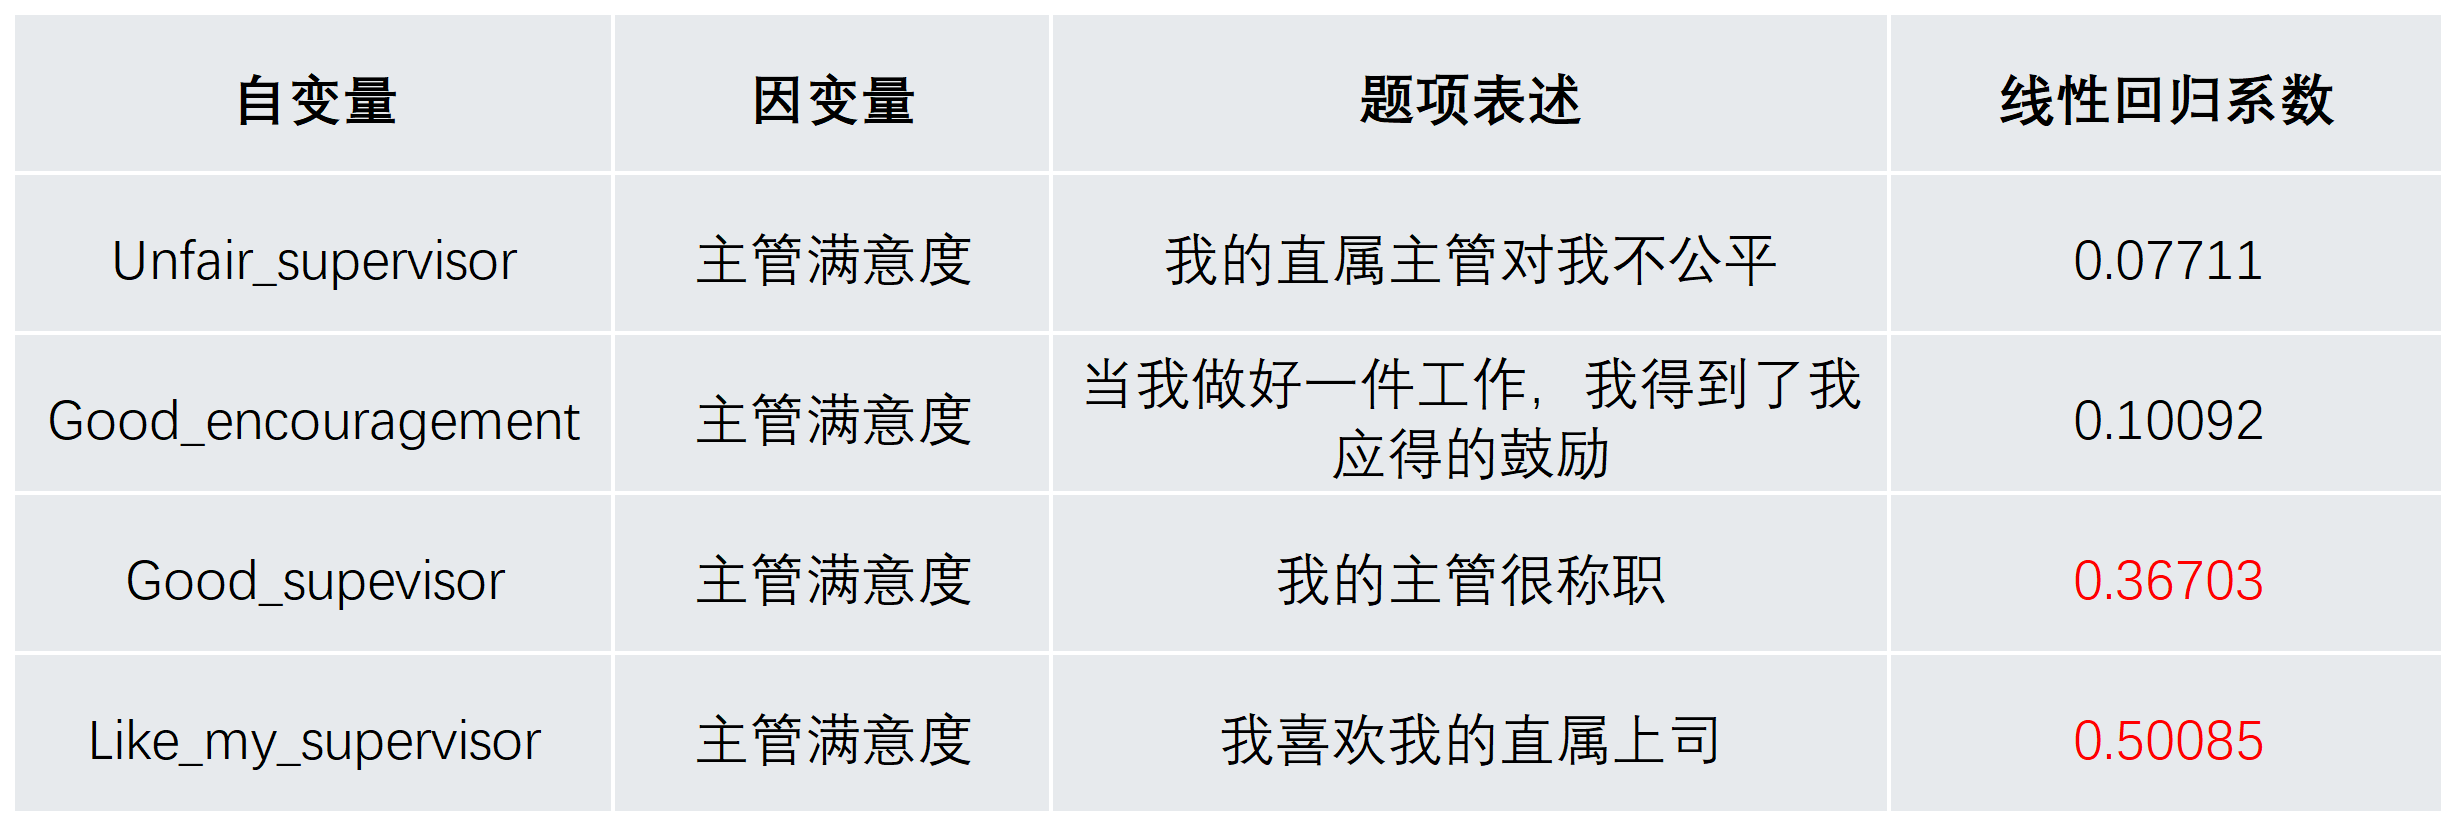
(The coefficient on the far right represents the linear regression coefficient. A higher coefficient indicates a greater impact on the rating results. The same applies below.)
Employees’ satisfaction with their direct supervisor is most influenced by whether they like their supervisor and whether they perceive their supervisor as competent.
2、Promotion
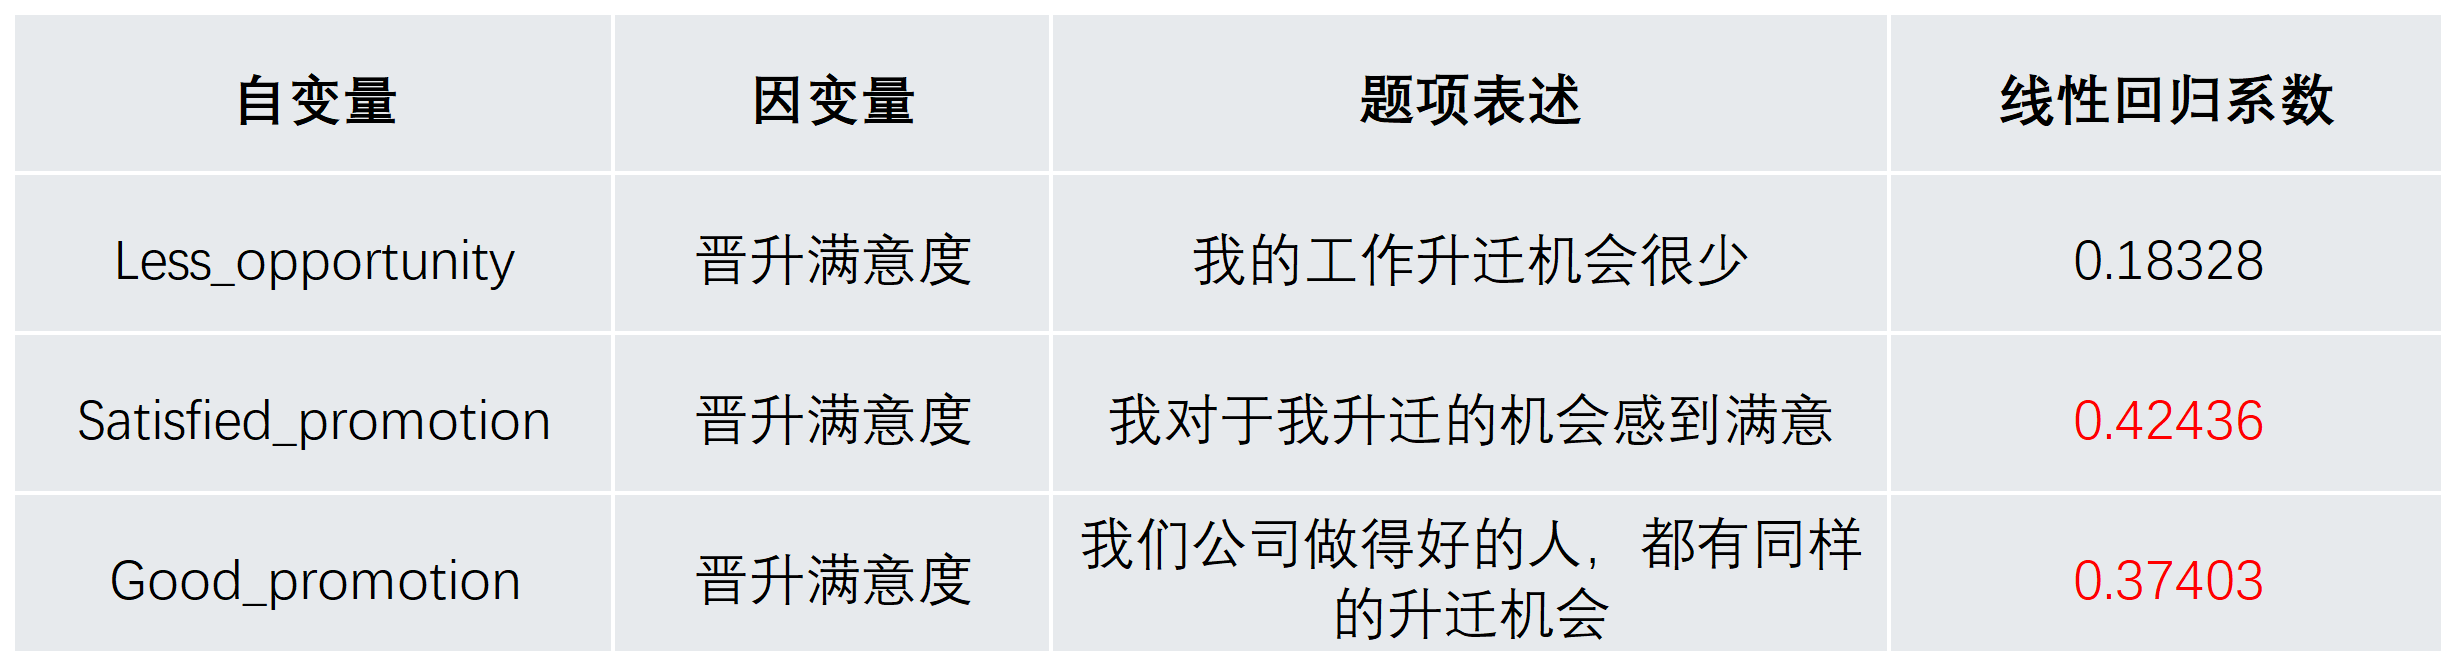
Whether employees are satisfied with promotion opportunities and whether promotions are perceived as fair are the two most significant factors affecting promotion satisfaction.
3、Salary and Benefits
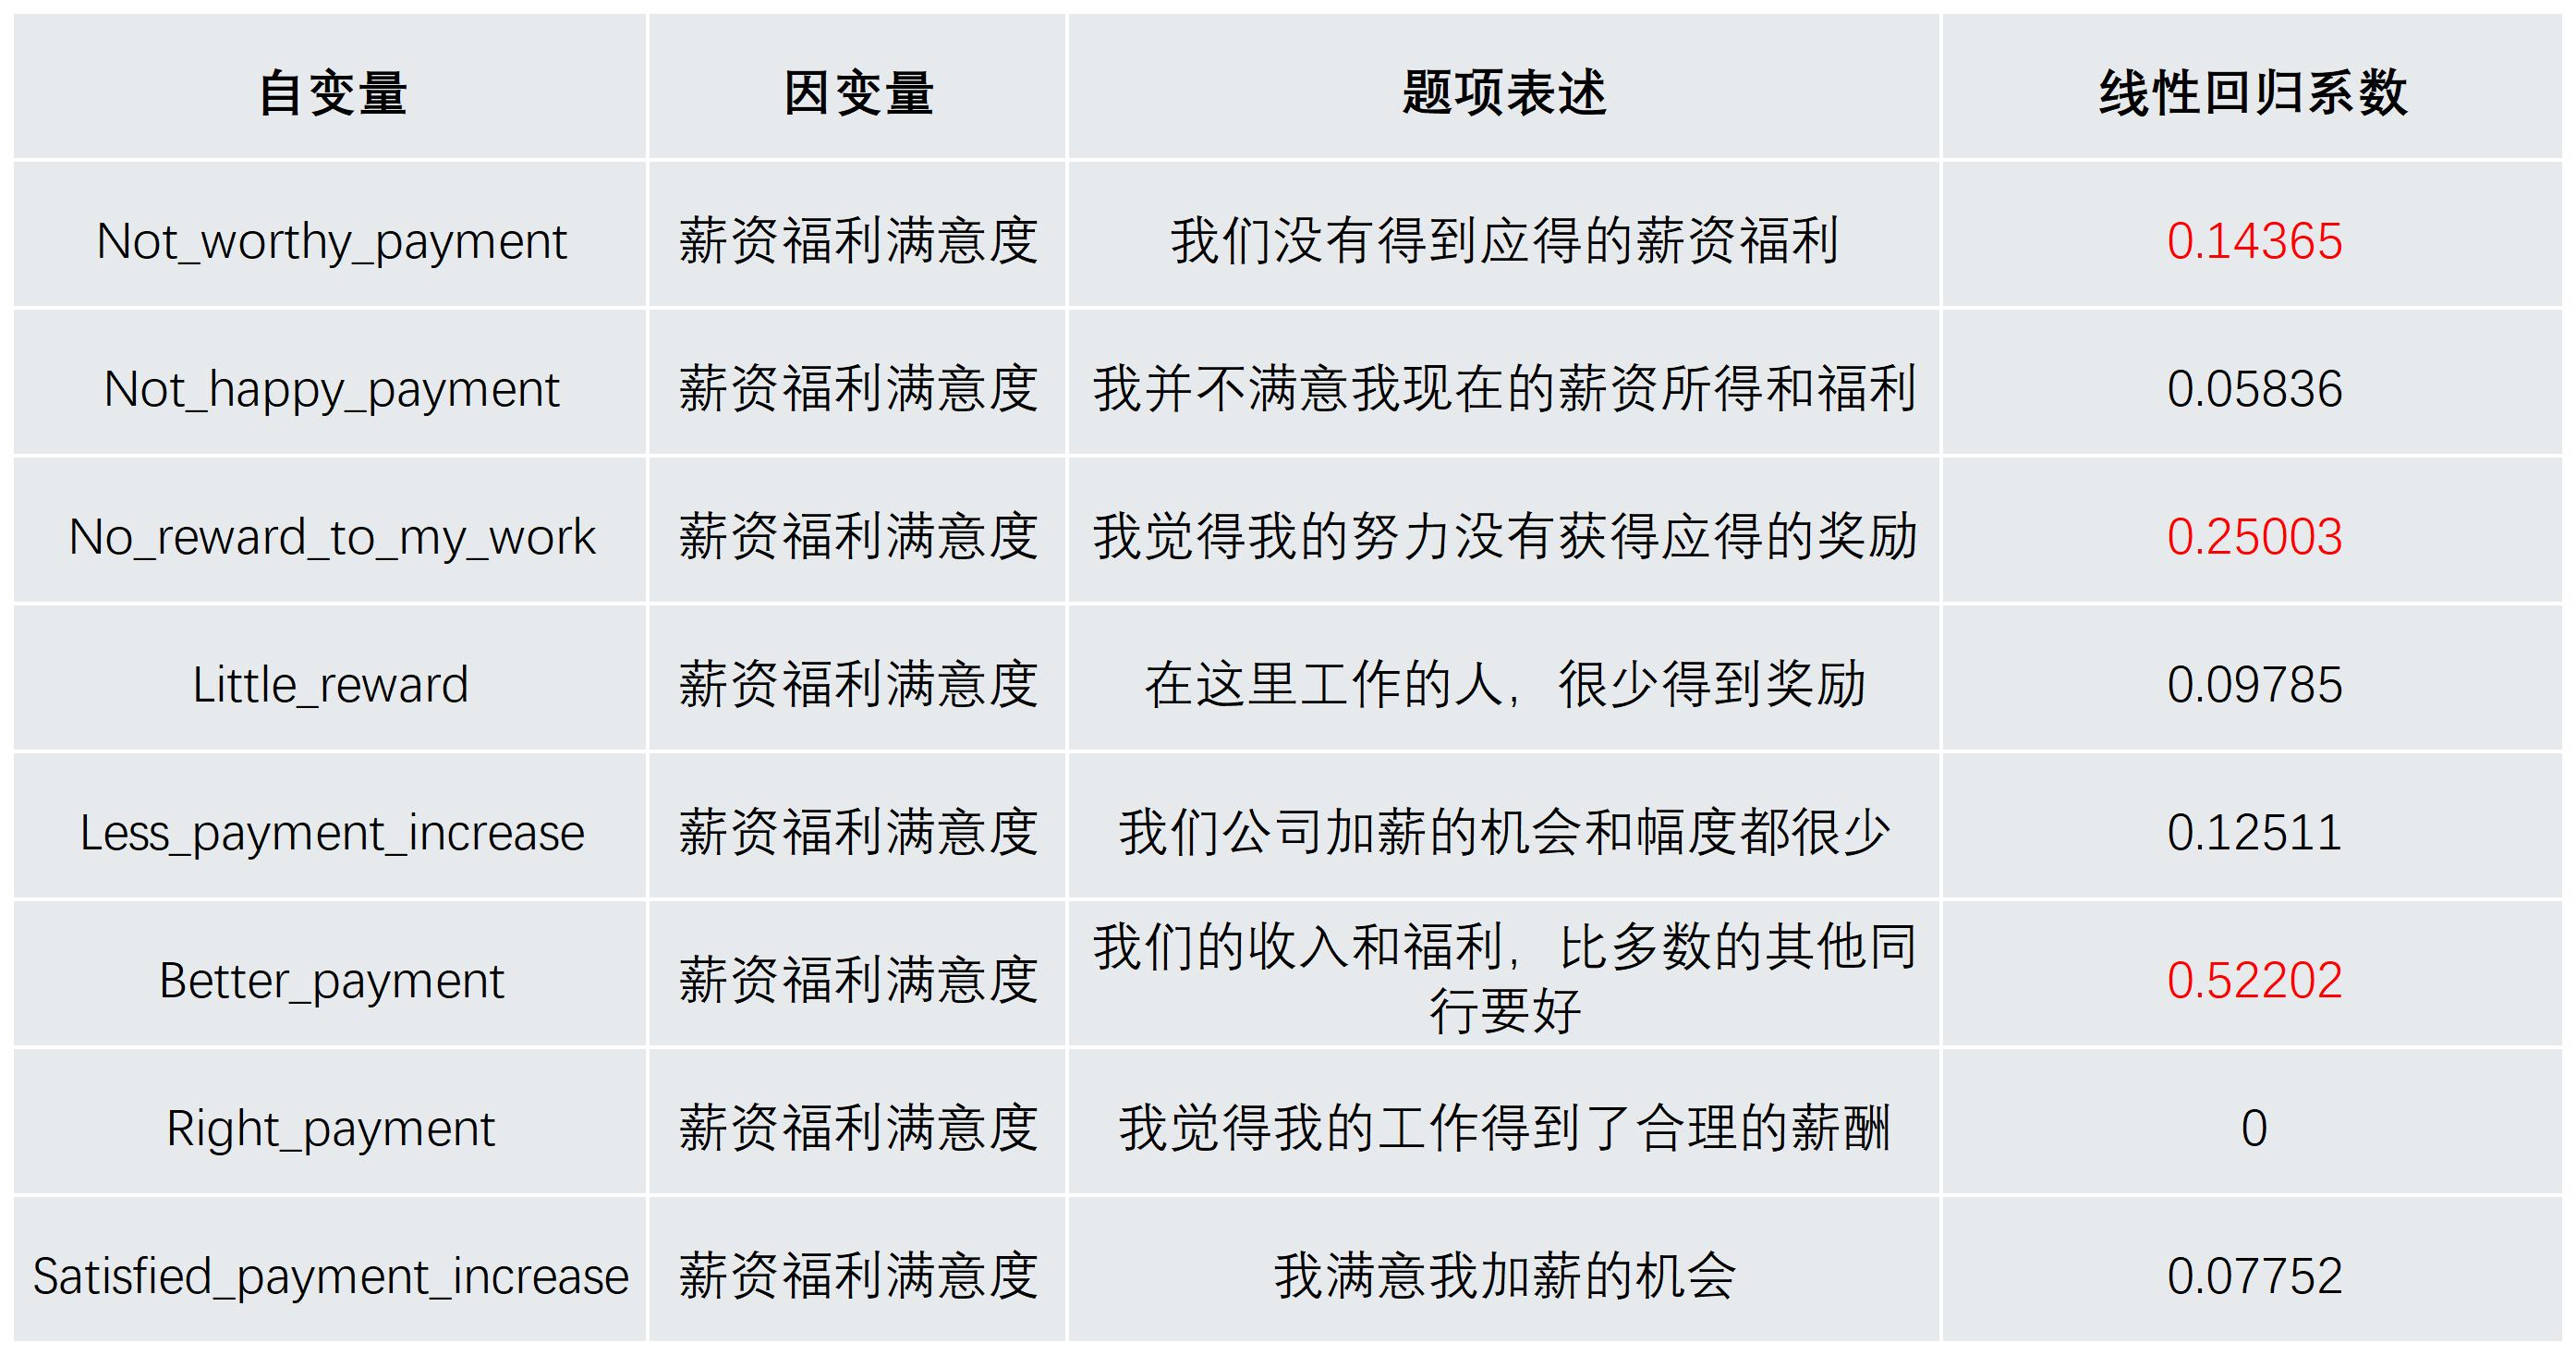
Most employees do not focus on the absolute value of salary and benefits but rather on whether they are fair compared to industry peers and justified in relation to their own efforts.
4、Job Attributes

Instilling a sense of pride and passion in employees for their work determines their level of satisfaction with job attributes.
5、Cooworkers

These two questions essentially test the same issue, which is why their correlation coefficients with the results are identical. This also, to some extent, validates the rationality of the questionnaire design.
6、Communication
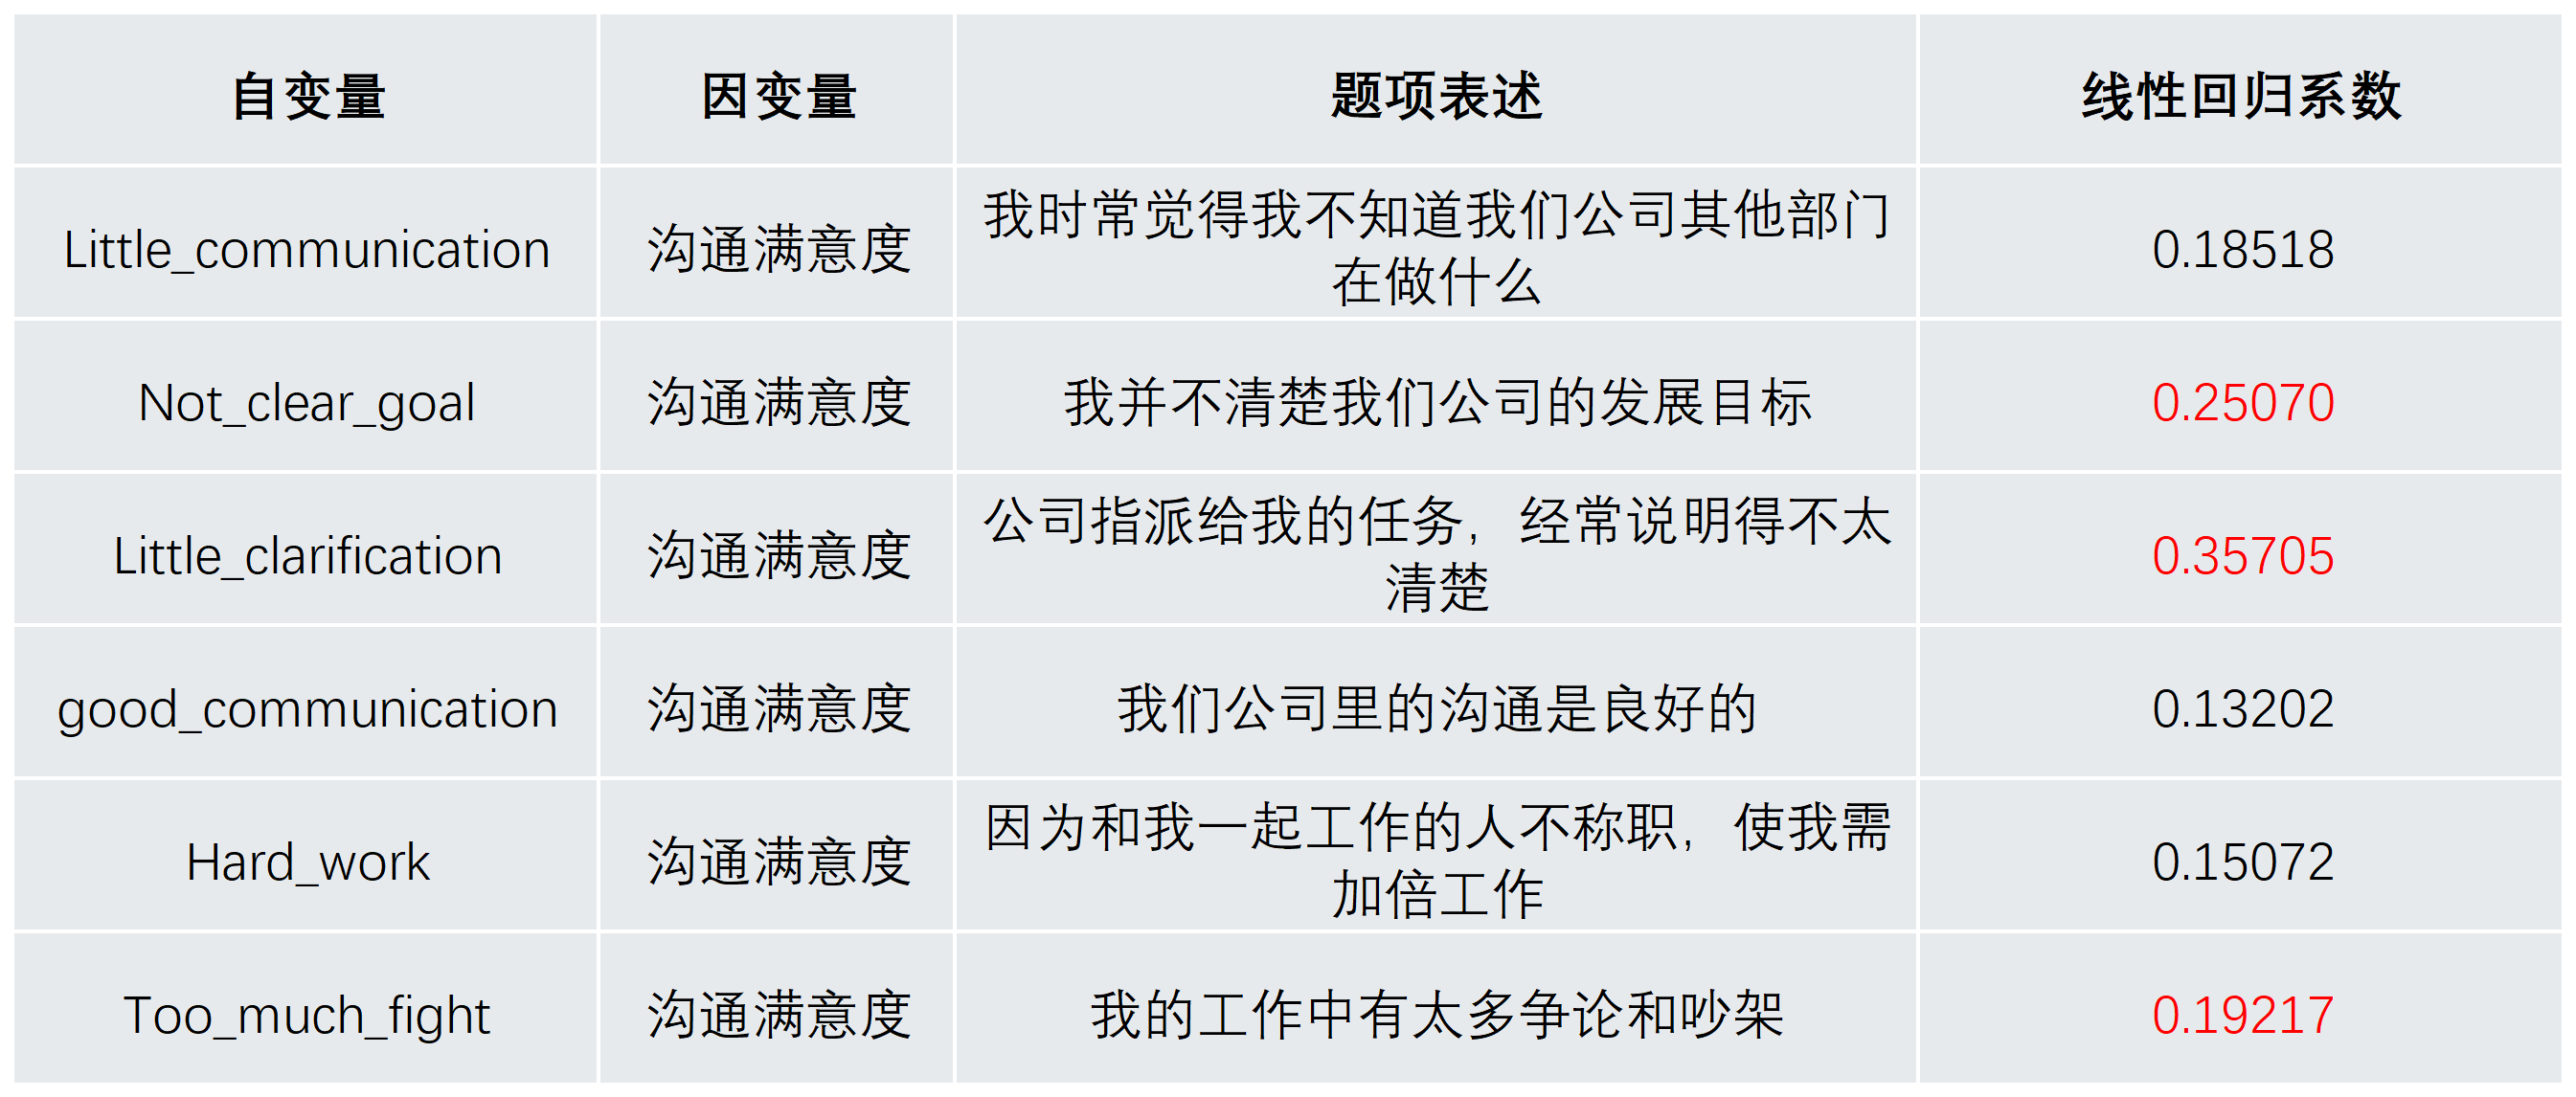
Unclear task assignments, lack of understanding of the company’s development goals, and excessive workplace disputes are the top three factors impacting employees’ evaluation of internal communication.It is important to clarify that different questions under the same factor are inherently correlated; otherwise, they would not be classified under the same factor.

Evaluation Scores of the Six Key Factors Affecting Employee Job Satisfaction
This data is derived by calculating the weighted average of different questions under each factor, then determining the variance between each respondent’s value and the average. The chart visually represents these variations.
1、supervisor

(Interpretation of the Factor Score Distribution Chart: The yellow line represents the average value, with 0 indicating the mean score. The left side of 0 represents the proportion of respondents who are dissatisfied, while the right side represents those who are satisfied. The horizontal axis indicates the variance from the average. A higher variance means the score deviates further from the mean. The further left, the lower the score; the further right, the higher the score. The same applies below.)
From the chart above, it is evident that employee dissatisfaction with their supervisors is relatively high. The lowest score deviates nearly 2.5 standard deviations from the mean (a greater variance indicates a greater distance from the average, meaning lower scores). In contrast, on the satisfaction side, the highest score is approximately 1.6 standard deviations away from the mean.
However, in terms of proportions, the number of respondents with satisfaction scores above the average is not significantly lower than those with dissatisfaction scores. This suggests that a considerable number of employees are relatively satisfied with their supervisors.
That being said, there is a potential data bias here. Since we did not differentiate between business owners and employees, some of the high scores might come from business owners evaluating themselves.
2、Promotion

From the chart above, it is evident that the distribution of dissatisfaction and satisfaction with promotions is asymmetrical. The lowest score deviates nearly 1.8 standard deviations from the mean (0), while on the satisfaction side, the highest score is approximately 2.5 standard deviations away from the mean. This indicates that some respondents are highly satisfied with their promotion opportunities, although they represent a relatively small proportion.
In terms of proportions, the number of respondents with satisfaction scores above the average is not significantly lower than those with dissatisfaction scores. This suggests that a considerable number of employees are relatively satisfied with their promotions.
3、Salary and Benefits
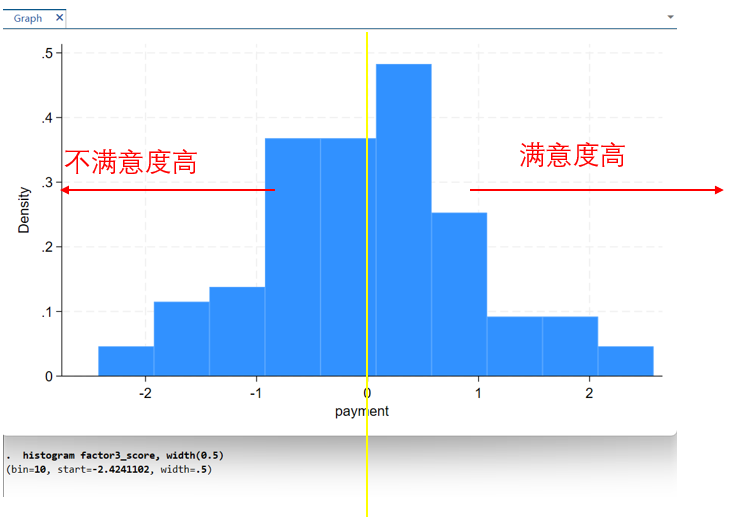
From the chart above, it is evident that the distribution of dissatisfaction and satisfaction with salary and benefits is also asymmetrical, but both are mostly concentrated within ±1 standard deviation, indicating a relatively centralized data distribution. The lowest score deviates nearly 2.5 standard deviations from the mean (0), while on the satisfaction side, the highest score is also about 2.5 standard deviations away from the mean. This suggests that some respondents are highly satisfied with their salary and benefits, while others are extremely dissatisfied.
However, the proportion of these extreme cases is relatively small. Looking at the overall distribution, the proportion of respondents with satisfaction scores above the average is not significantly lower than those with dissatisfaction scores. This suggests that a considerable number of employees are relatively satisfied with their salary and benefits.
4、Job Attributes

From the chart above, it is evident that the distribution of dissatisfaction and satisfaction with job attributes is also asymmetrical, but both are mostly concentrated within ±1 standard deviation, indicating a relatively centralized data distribution. The lowest score deviates nearly 2.8 standard deviations from the mean (0), while on the satisfaction side, the highest score is about 1.8 standard deviations away from the mean. This suggests that some respondents are highly dissatisfied with their job attributes, but this group represents a relatively small proportion.
Among those who selected dissatisfaction, the data is more scattered, meaning their levels of dissatisfaction vary significantly. On the other hand, among those whose satisfaction scores exceed the average, the data is more concentrated, indicating a more consistent perspective among satisfied respondents.
5、Cooworkers
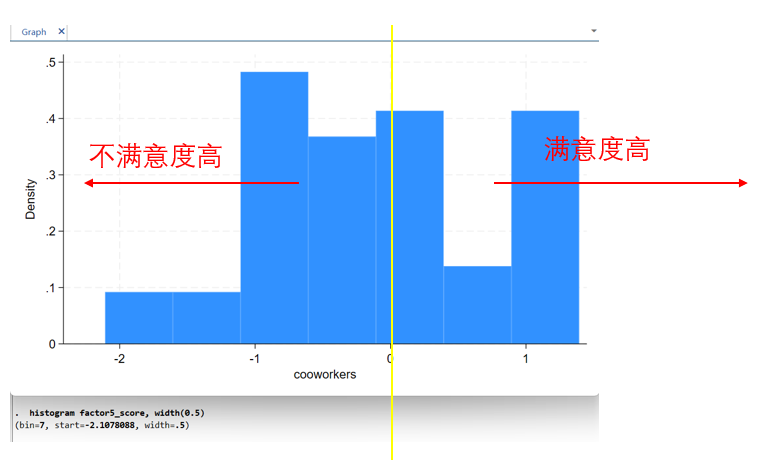
From the chart above, compared to the previous groups of data, employee dissatisfaction with teammates is higher than satisfaction, although both are mostly concentrated within ±1 standard deviation, indicating a relatively centralized data distribution.
On the dissatisfaction side, the lowest score deviates nearly 2.1 standard deviations from the mean (0).
On the satisfaction side, the highest score is about 1.5 standard deviations from the mean. This suggests that some respondents are quite dissatisfied with their teammates.
6、Communication
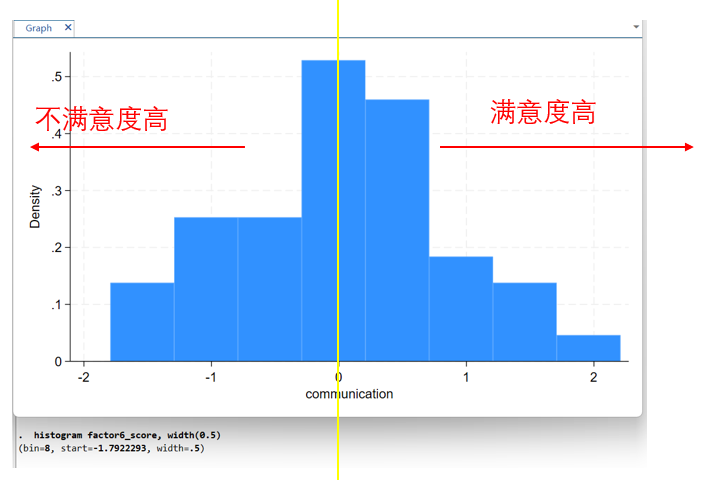
From the chart above, compared to the previous data groups, employees’ evaluations of internal corporate communication appear relatively balanced.
- On the dissatisfaction side, the lowest score deviates nearly 1.8 standard deviations from the mean (0).
- On the satisfaction side, the highest score is approximately 2.3 standard deviations from the mean.
This suggests that some respondents are quite satisfied with internal corporate communication.
Summary:
Regarding job satisfaction, the data indicates that the situation is not as negative as one might assume. A considerable number of employees are relatively satisfied with their jobs.
However, this may be partially influenced by the nature of the Lengyun Fashion Circle. The Lengyun Fashion Circle is an industry community that has existed for eight years, primarily consisting of individuals who are passionate about the fashion industry, goal-driven, proactive, and dedicated to their work.

Relationship Between Factors and Gender, Age, and Income
From a statistical perspective, gender, income, and age do not show a statistically significant impact on the factors in this survey. However, statistical “significance” requires a high threshold.Looking at the detailed breakdown below, gender, age, and income do influence the rating results to some extent, but this impact does not reach the level of statistical significance. This may be partially due to the limited sample size in our survey.
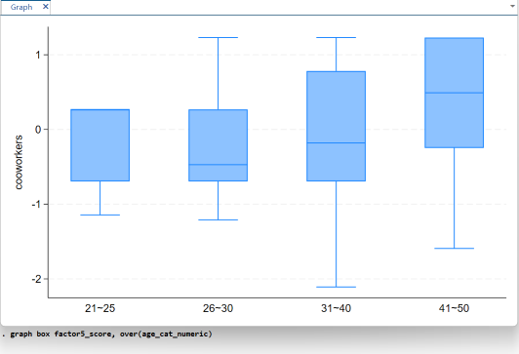
1、Relationship Between Age and Supervisor Factor

Compared to relying solely on averages and absolute values, a box plot allows us to view five key data points of a data set in one chart: maximum value, minimum value, upper quartile, lower quartile, and median (as explained in the figure above, the same applies below). This helps us understand the distribution and dispersion of the data.In the chart below, the longer the box, the more dispersed the data, indicating that the ratings are not concentrated.
For all age groups, ratings are mainly concentrated between 0 and 1. The older the respondents, the greater the variation in their ratings of their supervisors, meaning their views on supervisors are more inconsistent. In contrast, the 21-25 age group has the most consistent evaluations of their supervisors.
This could be because, with age and experience, older individuals tend to develop their own established framework for evaluating people, while younger individuals generally have a simpler evaluation system.Interestingly, the 26-30 age group rates their supervisors the lowest. We will explore the reasons for this phenomenon in the upcoming factor analysis.
2、Relationship Between Age and Promotion Factor
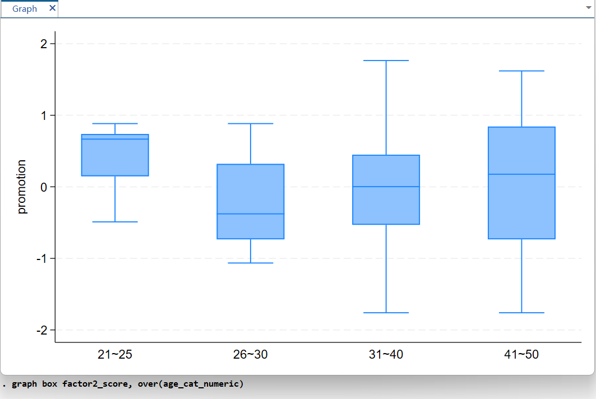
This data set is very similar to the previous one in terms of data distribution. The older the respondents, the greater the variation in their ratings of promotions, meaning their views on promotions are more inconsistent. In contrast, the 21-25 age group has the most consistent evaluations of promotions. This may be because individuals in this age group likely understand that their chances of promotion at this stage are limited, so they have relatively low expectations.The 40-50 age group shows a wide range of ratings. This is consistent with the earlier evaluation of supervisors: individuals in this age group have either already been promoted or are unlikely to have further promotion opportunities.
Interestingly, the 26-30 age group rates promotions the lowest. Combining this with their earlier evaluation of supervisors, we can infer that individuals in this age group have accumulated a certain amount of work experience and are in the optimal age range for promotions. However, in reality, their opportunities for promotion are limited, leading to lower satisfaction in this area.
3、Relationship Between Age and Salary & Benefits

This data set differs somewhat from the previous one in terms of distribution. First, the dispersion of the data in this group is higher than in the previous one, indicating that opinions on this aspect are more varied. However, the ranking still shows that the most dissatisfied group is the 26-30 age group, which is consistent with the previous factor analysis.
The blue dots represent outliers, which are data points that deviate significantly from the rest. These outliers may have been caused either intentionally or unintentionally, resulting in values that differ from the rest of the data. For example, if the data set includes 1-3-7-10, and suddenly a value of 100 appears, 100 would be considered an outlier, as it is far removed from the main group of data.Since there are few outliers, we have chosen to ignore them in this analysis.
4、Relationship Between Age and Job Attributes
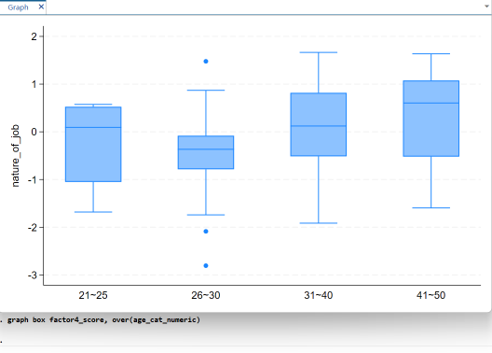
The distribution here is also noticeably different from the previous groups.
- The 26-30 age group remains the most dissatisfied, with their ratings being very concentrated, and almost all of them are negative (dissatisfied), indicating a consensus in their views.
- The 21-25 age group is relatively less dissatisfied, with their highest rating only around 0.5. This value is also lower than that of people in the 31-50 age range.
- The 30-50 age group shows relatively higher satisfaction levels. However, their views are scattered between -1 and 1, indicating a higher degree of dispersion. This suggests that while some are quite satisfied, others are not as satisfied.
5、Relationship Between Age and Communication Factor
The distribution above shows:
- Relatively, some people in the 30-50 age group are satisfied, but the data shows a higher degree of dispersion, indicating that some are satisfied, while others are less satisfied.
- People in the 20-30 age group tend to rate communication lower, with most being dissatisfied with workplace communication. This aligns with our observations in the workplace. Younger individuals typically have less social experience, tend to communicate in a more straightforward manner, and may not always have a thorough understanding of things, leading to more communication difficulties, which is quite natural.
Summary
- The lowest job satisfaction is seen in the 26-35 age group.
- In the 31-50 age group, there is a strong polarization in opinions
6、Relationship Between Gender and Supervisor Factor
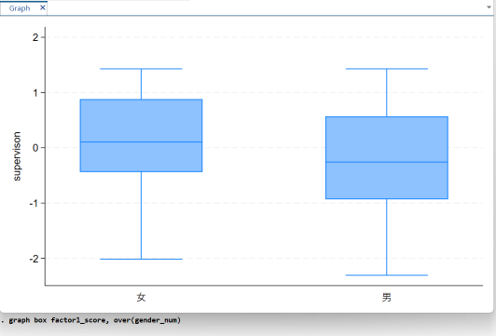
Female ratings are slightly higher than male ratings. This may be because, in the fashion industry, there are more female supervisors and employees. Relatively speaking, women may find it easier to communicate with other women, especially in areas like communication, stress management, and emotional management. This could be a characteristic of the fashion industry.
7、Relationship Between Gender and Promotion Factor
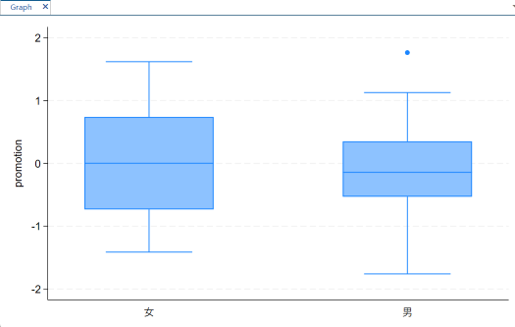
Male satisfaction is slightly higher than female satisfaction. Does this, to some extent, suggest that even in a predominantly female fashion industry, the phenomenon of different compensation between genders still exists.
8、Relationship Between Gender and Salary & Benefits Factor

Male satisfaction is slightly higher than female satisfaction. Does this, to some extent, suggest that even in the predominantly female fashion industry, the phenomenon of different compensation based on gender still exists.
9、Relationship Between Gender and Job Attributes

Female ratings are more concentrated, ranging between -0.5 and +0.5. Male ratings are more dispersed, mainly between -1 and 1.
10、Relationship Between Income and Supervisor, Promotion, Salary & Benefits, Job Attributes, Teammates, and Communication (Factor Scores)

The data for the six major factors is relatively consistent, so we will focus on analyzing them together. The group with the highest satisfaction is those with an annual income of over 500,000, which aligns with common sense.
The group with the lowest satisfaction is those with an annual income between 60,000 and 250,000. We can infer that individuals earning over 60,000 are generally new to the workforce and have more realistic expectations about their careers.
However, the 60,000-250,000 income group is primarily made up of individuals in the 25-35 age group. These individuals have accumulated some professional experience and have high expectations for their careers, but reality has not met their expectations.

Summary of 2024
1、Personal Career Summary for 2024

Top Five Keywords:
Challenge, Growth, Learning, Anxiety, Pressure
This suggests that although the environment is difficult, most people are still finding ways to improve themselves. This may be partly due to the fact that the Lengyun Fashion Circle consists of a group of people who are passionate about learning.
2、2024 Personal Summary of Observations of People Around Me
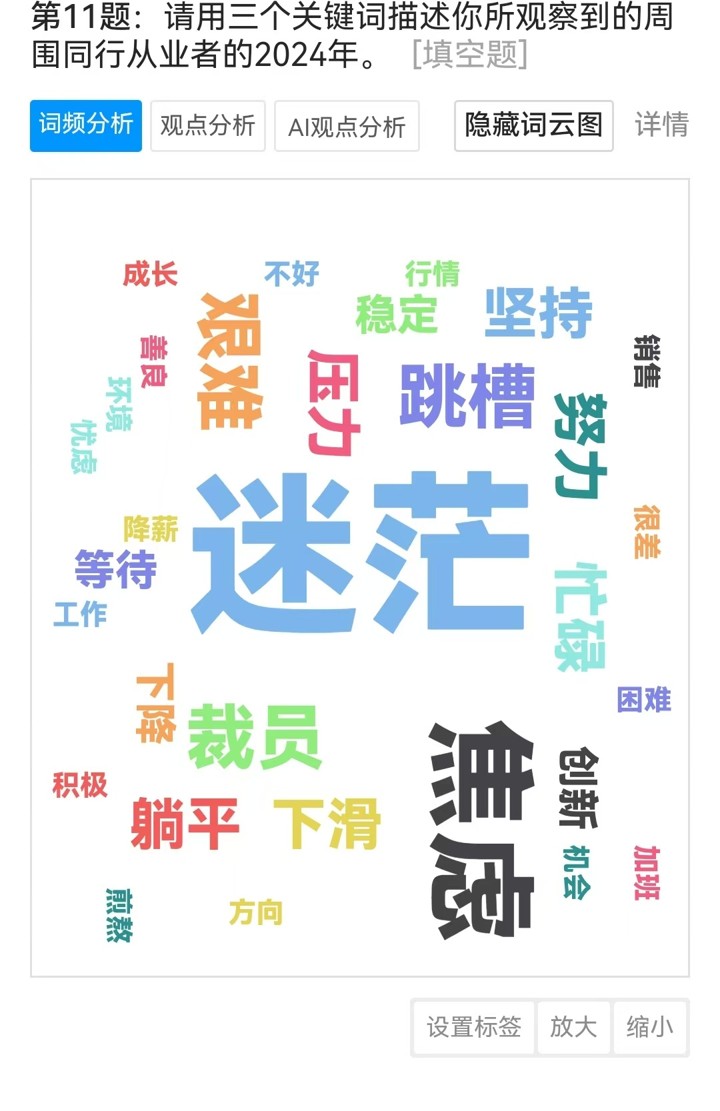
Top Five Keywords:
Confusion, Anxiety, Struggles, Layoffs, Job Hopping
This suggests that most people are experiencing confusion, anxiety, and difficulty.
3、Personal Observation Summary of the Footwear and Apparel Industry for 2024
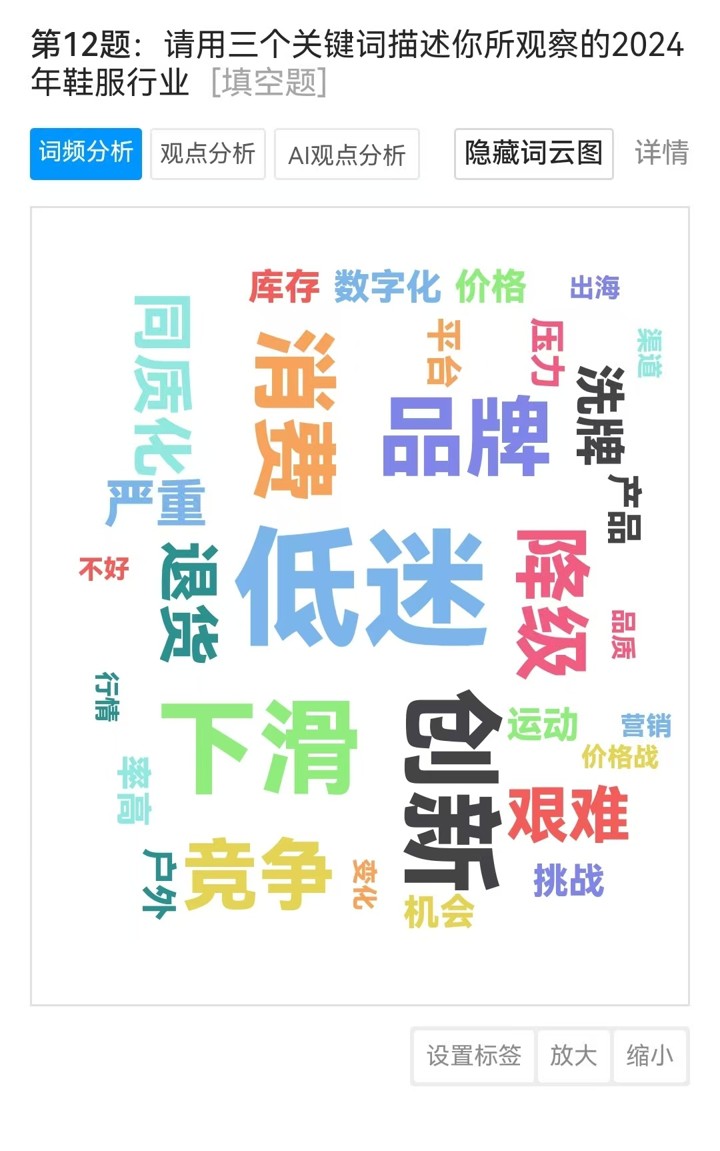
Top Five Keywords:
Sluggish, Innovation, Decline, Brand, Consumption
This suggests that although the overall situation is sluggish and performance is declining, companies are trying to rescue themselves through innovation and building brands.
4、2024 Personal Summary of the Company I Work For

Top Five Keywords:
Performance, Decline, Growth, Products, Innovation
This is similar to the previous industry. A significant number of companies have not given up but are actively trying to rescue themselves.
5、2024 Characteristics of Best-Selling Products in the Footwear and Apparel Industry
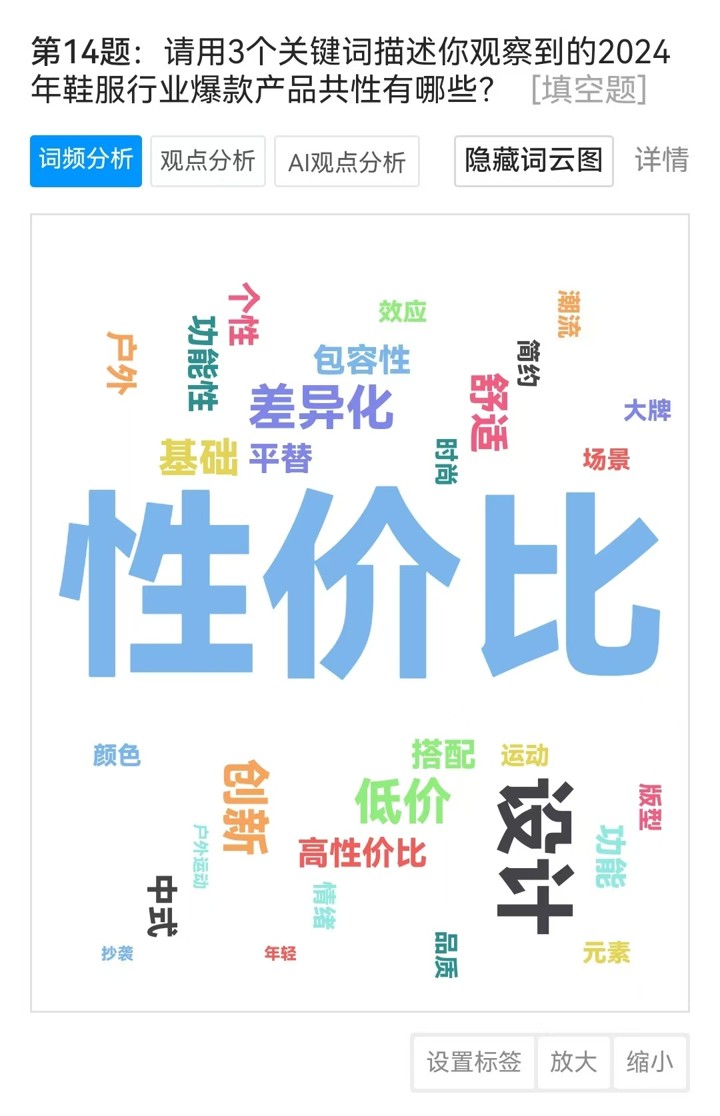
Cost-effectiveness has gained an absolute advantage.
6、2024 Characteristics of Unsold Products in the Footwear and Apparel Industry

Cost-effectiveness and homogenization are considered the biggest characteristics of slow-moving products. This indicates that while everyone recognizes cost-effectiveness as a trend, most companies only understand it as cheap prices. In reality, achieving true cost-effectiveness requires high standards in management and operations. In the industry, the companies that truly achieve cost-effectiveness are likely Uniqlo and ZARA.
Q: Which footwear and apparel companies, to your knowledge, have seen an increase in performance in 2024 compared to 2023?
A: Mainly the well-known sports brand companies. Sports brand companies have almost become the only winners in the footwear and apparel industry in 2024.
Q: What is the performance of the companies where the survey participants work?
A: 52% of companies have seen a decline, with the decline ranging from 11% to 30%. 34% of companies have experienced growth, with the growth ranging from 10% to 20%. 14% of companies have remained flat.


About 2025
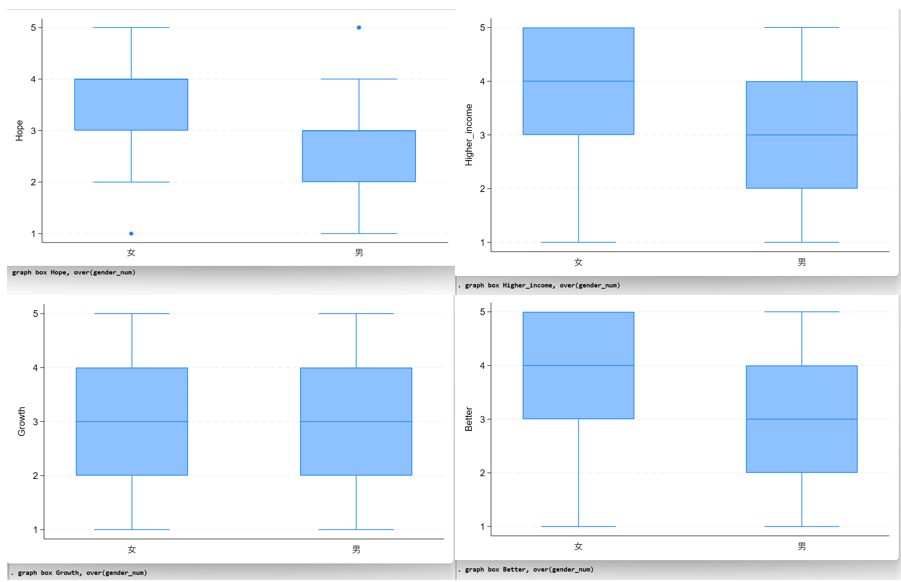
1、 Women (left column) are more optimistic about 2025 compared to men, believing that 2025 will bring more opportunities, higher income, business growth, and better career prospects.
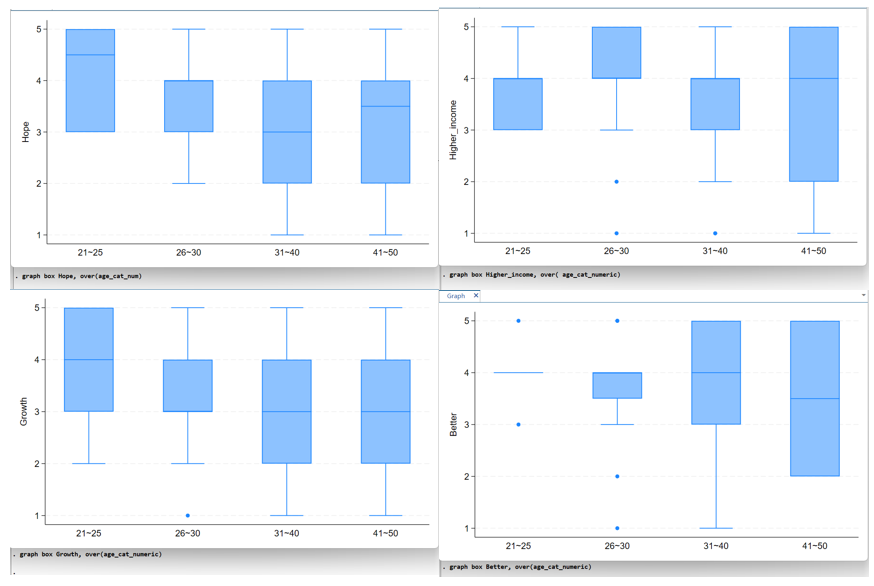
2、There is a lack of consensus among different age groups regarding their expectations for 2025, with the data being quite scattered and a significant polarization in opinions. Relatively speaking, the 26-30 age group has the most concentrated views.
3、There is also a lack of consensus among different income groups regarding their expectations for 2025, with the data being quite scattered and a significant polarization in opinions.

⭐ Final Summary
- In terms of job satisfaction, the situation is not as bad as the public might imagine. A significant portion of the population is satisfied with their work and the industry.
- Relatively speaking, the 26-30 age group has the lowest job satisfaction, while the 31-50 age group shows a polarized distribution of job satisfaction.
- Opinions regarding 2025 are also polarized.
- Relatively speaking, women are more optimistic and positive about their expectations for 2025 than men.
- A significant number of companies and individuals are pushing through tough times, breaking through challenges, and improving themselves.
If you would like to conduct professional-level market or employee research for your company, feel free to contact us using the following methods.


Leave a comment